
The Monthly Metric: Using the ISM® Report On Business®

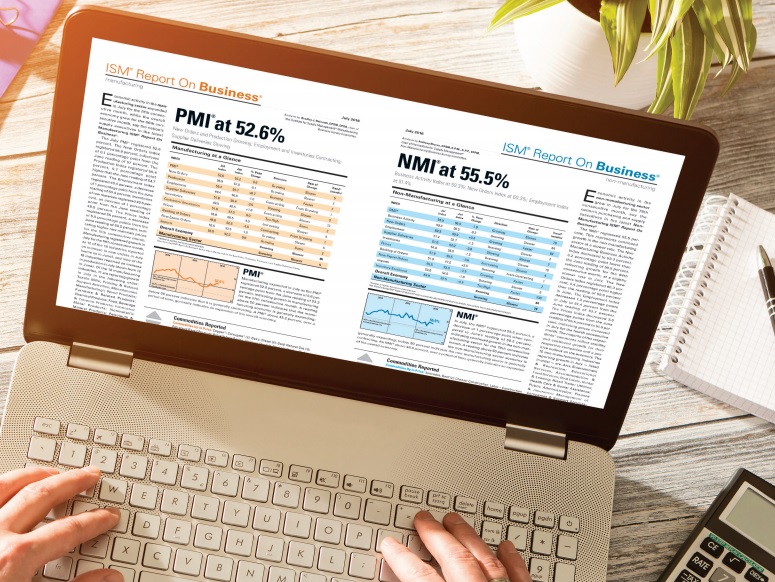
The Manufacturing and Services ISM® Report On Business® are released, respectively, on the first and third business days of the month, commanding much attention from economists and investors — and often influencing market activity.
Long recognized as among the most reliable economic indicators, the two reports, as well as the Hospital ISM® Report On Business® that comes out on the fifth business day, can also be a strategic information resource for supply management practitioners and executives. The report indexes are useful KPIs that have been discussed often in this space.
Institute for Supply Management® has issued the monthly manufacturing report since 1931, and the composite PMI® and subindexes are some of “the earliest advanced analytics,” Bob Mahlik, corporate vice president, global supply chain and procurement at Fortive, an Everett, Washington-based industrial technology company, told a session at the ISM World 2022 Annual Conference in Orlando, Florida, last month.
Each month, Mahlik sends a copy of the Manufacturing ISM® Report On Business® and his impressions of it to more than 100 leaders at Fortive. The company, which has 17,500 employees, more than 60 factories and distribution centers worldwide and projected revenue of about US$5.8 billion this year, uses the data as a factor in procurement and other business decisions,
“I send out the report with a two-point summary talking about how it’s relevant for us, to educate each of those executive leaders,” Mahlik told session attendees. “There isn’t a month that goes by without a question bounced back to me about the data, particularly about the impact on our business system.”
The insights Mahlik shares from the manufacturing report data include average lead times that Fortive can benchmark against its own performance; commodities that are up or down in price (for use in supplier negotiations) or in short supply (for inventory management), and the Employment Index, to gauge to prospective labor market. “(The report) connects relevance of the trends we are witnessing within our businesses to the broader trends across the industries,” said Mahlik, who outlined how the report’s 10 subindexes align with Fortive’s broader KPIs.
He added: “It helps us communicate results. More important, it helps us think about how to get those results.”
Meaning of the Metrics
The Manufacturing ISM® Report On Business® has 10 subindexes, which Mahlik said helps measure activity in three groups — customers, employees and shareholders — that drive Fortive’s highest-level KPIs. The subindex breakdown:
- Customers: Production, Supplier Deliveries and Backlog of Orders
- Employees: Employment
- Shareholders: New Orders, Inventories, Customers’ Inventories, Prices, New Export Orders and Imports.
Not all of the subindexes directly factor into the headline number, the PMI®. In the manufacturing report, the five subindexes used to calculate the composite PMI® are New Orders, Production, Employment, Supplier Deliveries and Inventories.
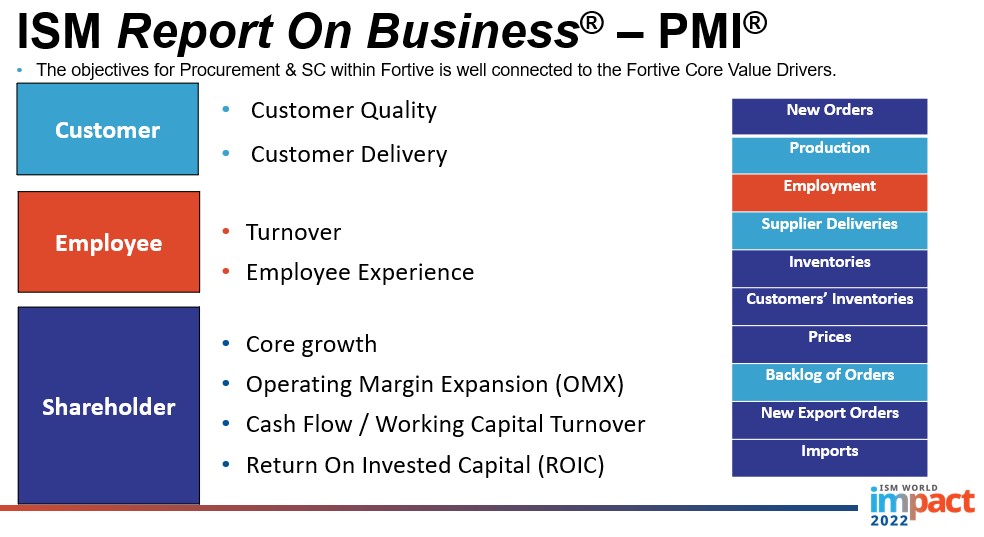
A slide from Bob Mahlik’s presentation at the ISM World 2022 Annual Conference shows how the ISM® Report On Business® subindexes align with Fortive objectives and KPIs.
For Fortive, the Supplier Deliveries Index and Buying Policy section — a part of the report that provides average lead time data in capital expenditures, production materials and maintenance, repair and operating (MRO) supplies — serve as benchmarks for the company’s customer KPIs on delivery and quality. The shareholders subindexes align with measurements of revenue, margin and inventory.
The ISM® Report On Business® data is included in Fortive’s monthly financial operating review meeting, Mahlik said, and he added that the listings of commodities up and down in price and in short supply have sparked, as he put it, “calls to action” on factory operations and purchasing decisions.
“This data from ISM helps coordinate and triangulate our strategies, then determine if they are on track,” Mahlik told session attendees. “Those of you who lead the function of procurement within your company have a genuine opportunity to use this tool to help guide you in communicating the impact, the importance of our function, as it relates to business outcomes.”
Getting Started on Using the Data
The first step in integrating the ISM® Report On Business® into a company’s operations and planning is having clear objectives, Mahlik said: “I wouldn’t start by just blasting the report out on broad distribution without any definition of what you’re trying to accomplish.”
A good start is to, as Fortive has, align the PMI and subindex data to company goals and KPIs. “Those (measurements) are consistently applied to every operating entity (at Fortive),” Mahlik said. “When you speak the language of what winning looks like in your company, and tying in the measures of relevance, you will have greater success in using this data to convey your message.”
Such data as lead times, commodity prices and supply levels — knowledge that is especially valuable in times of economic uncertainty — help practitioners stay on top of trends, Mahlik said.
He ended the session by challenging procurement leaders in the room to leverage the ISM® Report On Business®, not only as a performance differentiator but as a way to help advance the supply management profession.
“You’re helping propagate our message with this tool, which has outstanding analytics if only used properly,” he said. “Even if you’re not leading a function, if you’re an individual contributor and have influence with those you collaborate with, make this report a bigger part of the conversation and to do so regularly. When you integrate it into the job you do, that’s going to make an impact.”
To suggest a metric to be covered, email me at dzeiger@ismworld.org.