Inside Supply Management Magazine
A Data Dashboard Can Help You Get Ahead

Procurement practitioners can learn how their companies are performing, as well as what type of plans to make in relationship to the economy, by creating a dashboard that tracks the ISM® Report On Business®, released monthly by Institute for Supply Management®, and other pertinent government reports and indexes.
“Senior leaders tell us they want any insight into what’s going on, but they want quick overviews,” says Kristina Cahill, Manager, ISM Research & Analytics. “A dashboard will provide that.”
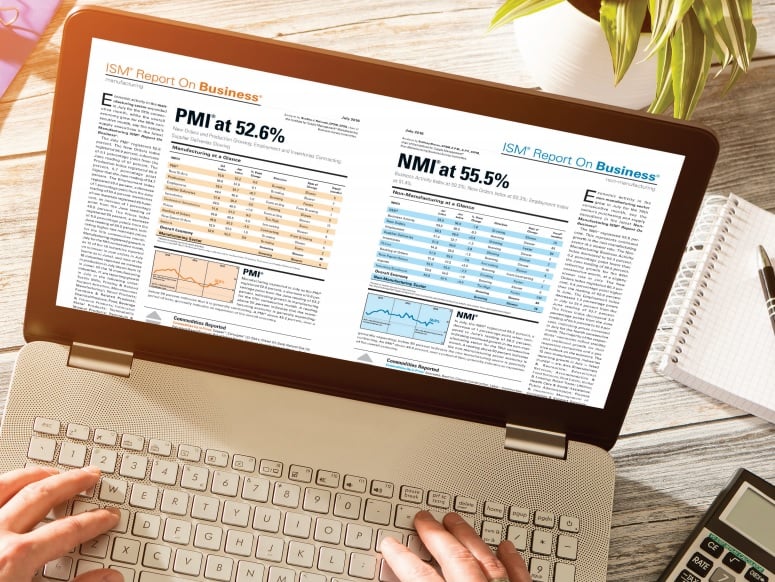
The ISM® Report On Business® (ROB) is known as the No. 1 non-government indicator of the health of the U.S. economy, she says. It contains numerous components, each of which can give you a look into how the economy is faring. One is the sector outlook: For manufacturing, there is the PMI®, and for non-manufacturing, the NMI®. Each sector is further divided into individual indexes, such as Prices, Supplier Deliveries and Inventories. Additionally, the report tracks commodities up and down in price, as well as in short supply.
On the dashboard, include the ROB’s PMI® and NMI® indexes as well as focus areas that are of particular interest to your company. These can include specific indexes, categories and commodities.
“Be sure to use more than the ISM® Report On Business® information,” Cahill recommends. “Combine it with your own observations or data from other places, like government reports and indexes. You want to diversity a bit.” For example, you’ll also want to track gross domestic product (GDP), which lags the ROB, and other factors that may include consumer confidence index levels, 10-year Treasury note performance and Producer Price Index.
Other factors to be cognizant of include inflation, trade and tariff issues, geopolitical events and natural disasters, she says.
By looking at indexes over time on your dashboard, “you can see patterns based on how indexes behaved historically, and you can start finding correlations as to how the economy or indexes are behaving now and what’s likely to happen in the future,” Cahill says. You can then determine where your company fits in — and determine if future considerations, for example, regarding inventory levels, need to be made.
“In a dashboard, it’s good to look at a 12-month overview, to see where we’ve been and where we’re likely to go,” Cahill says. “Coming up with an average also can be helpful.”
So is looking at dips and peaks in the data. For example, “if you see the numbers fall sharply in a month, you’ll know that something newsworthy — for example, new legislation enacted — happened,” she says. “But then, the index will generally go back up. Historically speaking, indexes don’t jump up and down, they tend to taper.”
Creating a dashboard not only helps your company, it also enables you to enhance your value to the company. “If you have insight into conditions right now and where things are headed, you’ll be ahead of your peers,” Cahill says. “Because your coworkers or competitors aren’t using this, you can be the one person who becomes the expert at your organization in presenting a macroeconomic view and explaining to company leaders why it’s important to know what is coming down the road.”

