August 2026 ISM® Services PMI® Report
Services PMI® at 55.4%
Economic activity in the services sector continued to expand in August, say the nation’s purchasing and supply executives in the latest ISM® Services PMI® Report.
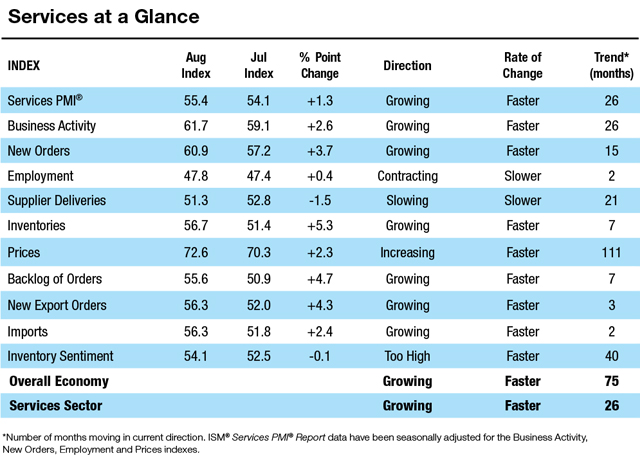
The Services PMI® registered 55.4 percent, the 26th consecutive month in expansion territory. The Business Activity Index remained in expansion territory in August, increasing 2.6 percentage points to 61.7 percent from July’s reading of 59.1 percent. The New Orders Index registered 60.9 percent, 3.7 percentage points above July’s figure of 57.2 percent. The Employment Index contracted for a second straight month with a reading of 47.8 percent, a 0.4-percentage point increase from the 47.4 percent recorded in July. The Prices Index registered above 70 percent for the fifth time in six months; the reading of 72.6 percent in August is 2.3 percentage points above July’s figure of 70.3 percent. The index has exceeded 60 percent for 21 straight months, with its 12-month average increasing by 0.4 percentage point to 68.5 percent, the highest since April 2023. The Inventories Index registered 56.7 percent, up 5.3 percentage points from July’s figure of 51.4 percent.
The 12 services industries reporting growth in August — listed in order — are: Mining; Real Estate, Rental & Leasing; Accommodation & Food Services; Wholesale Trade; Arts, Entertainment & Recreation; Educational Services; Retail Trade; Information; Professional, Scientific & Technical Services; Utilities; Transportation & Warehousing; and Public Administration.
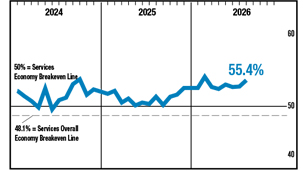
In August, the Services PMI® registered 55.4 percent, 1.7 percentage points above its 12-month moving average of 53.7 percent. A reading above 50 percent indicates the services sector economy is generally expanding; below 50 percent indicates it is generally contracting. The past relationship between the Services PMI® and the overall economy indicates that the Services PMI® for August corresponds to a 2.3-percentage point increase in real gross domestic product (GDP) on an annualized basis.
Commodities Reported
Commodities Up in Price: Computers and Related Items (4); Copper (9); Copper Based Products; Diesel (6); Food Products; Freight; Fuel* (7); Gasoline (7); Labor; Memory Products (8); Petroleum Based Products (4); Software — Licensing (7); and Steel Products (5).
Commodities Down in Price: Fuel* (3).
Commodities in Short Supply: Graphics Processing Units (GPUs); Labor (3); Memory Components (8); Steel; Steel Products (3); and Wire and Cable (3).
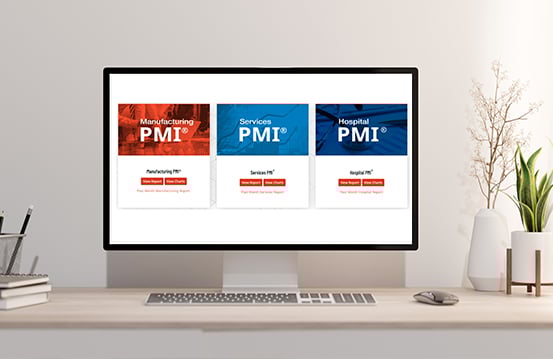
Note: To view the full report, visit the ISM® PMI® Reports website at ismrob.org
The number of consecutive months the commodity has been listed is indicated after each item. *Indicates both up and down in price.