


How Statistics Tell a Lean Six Sigma Story
A high-school student applies lessons from an advanced placement class while observing — and contributing to — a company’s process improvement.


In the advanced placement (AP) statistics course I took as a high school junior last year, I learned about how statistical analysis is applied in business settings. Upon further research, I found that many management decisions are based on such statistical analysis and many of the statistical principles I had learned.
Looking for opportunities to further my understanding of how statistical analysis helps business decision-making, I observed the implementation of a Lean Six Sigma process to reduce contracting cycle time at a local company. It was the team’s first experience with the process as well, and I had the opportunity to offer suggestions and insights, based on what I learned from AP statistics.
Lean Six Sigma’s data-driven improvement cycle includes five phases: define, measure, analyze, improve and control (DMAIC). This article describes the measure, analyze and improve phases of the company’s Lean Six Sigma initiative. For confidentiality reasons, I’ve modified some business terms used at the company and redacted numbers from the graphics.
Responsible for negotiating services agreements with suppliers, the team was tasked with reducing contract cycle time (CCT). Contracts fell into three groups — critical, basic and technical services. The team’s performance had been primarily measured by CCT, and also by on-time execution (OTE) percentage of contracts.
Some steps of the contracting process were handled by the contracting team, others by other functions. Contracting team members were sure of their management efficiency and that longer CCT was caused by factors within other functions, like scope of work (SOW) changes in the middle of contracting and longer finance approval time. However, they had done no statistical analysis to support their position, so they opted to apply Lean Six Sigma principles to identify opportunities to reduce CCT. As it was their first experience with the process, the team made a few mistakes, but the initiative was successful.
Although the define phase isn’t a focus of this article, it is important to note that the team built a solid project charter and engaged members from other functions to participate.
The Measure Phase
The measure phase was broken into three parts: data collection, data integrity, and stability and capability.
Data collection. The team built a system to collect data related to CCT and OTE percentage, breaking the contracting process into 10 sequential tasks and identifying the functions responsible for each. Among other measures, they
- Defined the start and end points for each task
- Recorded specifics of each contract — including (1) delivery time, (2) competitive-bidding status and (3) SOW changes — in the system to enable in-depth analyses
- Obtained tailored CCT reports about the specifics
- Built scatter plots for contracts and made them interactive to show CCT details.
Data integrity. Aware that analysis is only as good as the quality of data, the team worked to ensure data integrity. It held training on the new data-collection system, performed random and regular checks on data entries, and enabled system-generated messages pertaining to detected data entry errors.
Stability and capability. The team initially looked at the control chart for CCT to understand if its contracting process was stable and in control. However, there were two outliers in the control chart, which signaled instability and raised concerns about ability to perform further analysis. The team conducted a deep dive and determined the outliers were caused by situations that were unpredictable and beyond its control. One was caused by a sudden turnover at a supplier’s sales organization, resulting in a delay in naming a new account representative. The other was the result of a request to negotiate a special contract outside of normal responsibilities. The team determined the outliers were special cause variations and that it was acceptable to exclude them from further analysis. Accordingly, the new control chart — without the two outliers — showed a stable process.
The team also wanted to understand its current performance as compared against customer expectation. So, it obtained a process capability report which showed that for nearly a quarter of the time — 23.08 percent — its CCT was out-of-specification pertaining to internal customer expectation.
The Analyze Phase
As the team collected more data about contracts over several months, it began the analyze phase. Among the questions the analysis helped answer:
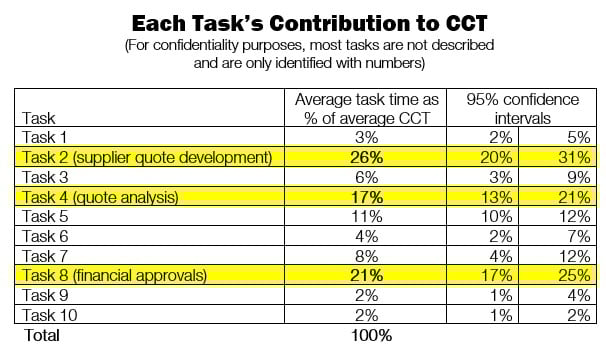
Which tasks are bottlenecks? The first result of the analysis was a table showing each task’s contribution to the CCT. Prior to the analysis, the team believed that Tasks 2 (supplier quote development) and 8 (financial approvals) — which were handled by other functions — were the bottlenecks. However, the table showed that Tasks 2, 4 (quote analysis) and 8 are the top three contributors to CCT.
The three tasks’ overlapping confidence intervals pertaining to “average task time as a percentage of average CCT” meant the team could not infer that Task 2 or 8 contributes more to CCT than Task 4, which is directly handled by the team (see chart below). The team could determine, with 95-percent confidence, that the interval of 20 percent to 31 percent captures Task 2’s actual average contribution to CCT.
The actual contribution percentage can be anywhere in this interval, and the probabilities of being anywhere in this interval are the same. The upshot: The team stopped blaming other functions for longer CCT and began a more collaborative approach with them to seek improvement. The team also learned that means by themselves can be misleading, and such data as confidence intervals need to be considered as well to see the whole picture.
Is one contracting group more efficient than the others? The team had believed that the critical-services contracting team executed contracts faster than the basic-services and technical-services contracting groups. So, it planned to have the critical-services contracting group train the other two groups.
However, an analysis of variance (ANOVA) test on the CCTs of the three groups revealed overlapping 95-percent confidence internals of average CCT. This analysis also showed a probability value (p-value) of 0.16, meaning the team failed to reject the null hypothesis that “the mean CCTs of the three contracting groups are the same.” (A p-value shows likelihood that data would have occurred by random chance if the null hypothesis is true. A p-value less than 0.05 is strong evidence against the null hypothesis, so the null hypothesis should be rejected. A p-value higher than 0.05 means the null hypothesis should not be rejected.)
Again, the team realized it had been misguided by comparing only the means. It decided to forego the training since it would not lead to CCT improvement.
Do SOW changes cause longer CCT? It’s logical that a change in SOW during contract negotiation would require a revised quote and renegotiation of the cost, lengthening the CCT. However, the team had never tried to quantify the impact of SOW changes on CCT, and this lack of analysis put it at a disadvantage when discussing CCT-related issues with other functions.
The team first turned to a regression model for insight, expecting the model to show that the more SOW revisions, the longer the CCT. They used the number of revisions as the explanatory variable (X), but then realized that this approach had two problems. One, the X data is counts (0, 1, 2 and so on) that counts are discrete data (which are not as good as continuous data for building regression models). Two, there were rarely more than two revisions, so X would have only three values (0, 1, and 2), which is not ideal for building regression models.
Team members then explored using continuous data to run a regression model. For each contract with SOW revisions, they calculated the time between the original SOW and the last revision. They called this period “lost days” because tasks performed during this period needed to be reworked.
Using “lost days” as the explanatory variable (X) and CCTs as the response variable (Y), they came up with the following model: CCT = 32.7 + 0.855 x “lost days.”
The team was pleased to see the positive correlation between “lost days” and CCT. However, I saw a flaw in this model: Since “lost days” is a part of CCT, X and Y are not independent, meaning this scenario is not ideal when running a regression model.
Team members ultimately concluded that hypothesis tests are better analytical tools for discrete X values and switched to a two-sample t-test — statistical analysis that helps to determine whether there is a real difference between the means of two groups. When the average CCT of contracts with SOW changes were compared with the average CCT of contracts without SOW changes, the test rendered a p-value of less than 0.001. This led them to reject the null hypothesis that “the mean CCTs of the two groups of contracts are the same.”
The team understood that the above analysis does not prove that SOW changes cause longer CCT. However, it now had proof that there was a statistically significant difference between the CCTs of two groups of contracts. The upshot: This is the best evidence the team could have received, since it is not practical nor possible to design an experiment to prove such causation (for example, to negotiate the same contract twice, one with revision and one without, while keeping everything else the same). This evidence helped the team’s credibility when it suggested other functions reduce SOW changes.
Are competitive biddings related to lower OTE percentage? Internal customer groups occasionally want to consider non-preferred suppliers. In these cases, competitive bidding is conducted, which adds a step to the normal contracting process. If the target date for contract execution is not extended accordingly, the contract may not be executed on time.
The team wanted to confirm its theory that competitive biddings are associated with lower OTE percentage. It investigated all contracts involving competitive bidding and obtained the OTE percentage — and also obtained OTE percentage for all contracts that didn’t involve competitive bidding.
A two-proportion test was conducted on the null hypothesis that “there is no difference in OTE percentage between the two groups of contracts,” the result of which was a p-value greater than 0.05. Since team members could not reject the null hypothesis, they decided to not push back on requests for competitive bidding.
While the team was disappointed that the test did not lead to the desired result, I pointed out that because few contracts involved competitive bidding, the sample size was small. As a result, there was a higher risk of a Type II error — the failure to reject a null hypothesis when it is false. I suggested the team repeat this two-proportion test as the sample size grew, with the hope that the analysis eventually would support its argument that lower OTE percentage pertains to adding competitive bidding in the contracting process.
The Improve Phase
Once they identified the three tasks that are the bottlenecks in the process, team members took a deep dive into each, obtaining a better understanding of the root causes, and made some changes. They include:
- For Task 2 — supplier quote development: The team worked with the R&D group to make the SOW clearer and more detailed. This helped to reduce the time needed for suppliers to clarify their questions about the SOW.
- For Task 4 — quote analysis: The team standardized quote-collection templates and made them more aligned with the SOW. It also decided to not spend as much time analyzing items below a certain dollar amount threshold.
- For Task 8 — financial approvals: It collaborated with finance to reduce the number of approvers without compromising the financial control.
The team also wanted to address the impact of SOW changes on the CCT. Since other functional groups own the development of SOW, the team made recommendations based on the findings from the analysis. They realized this is a challenging task and planned to collaborate with the other functional groups.
Future Analysis
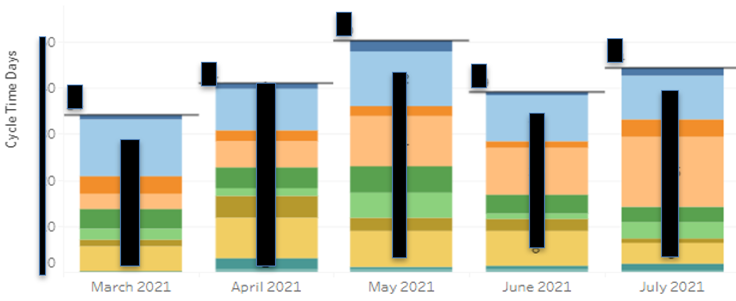
The team currently is tracking the CCT improvement overall, as well as at the task level. Figure 2 is an example of a tracking tool they developed: Each color strip represents a task in the contracting process. This tool not only shows changes in overall CCT over months, but also graphically identifies the tasks that contribute the most to CCT each month.
Going forward, as the database grows, the team will repeat the previous analysis to verify and fine-tune findings, and also will perform new analyses to identify more improvement opportunities.
Although I wasn’t able to observe many other activities the team did during the Lean Six Sigma initiative, the experience was eye-opening for me. I went through the twists and turns with the team on the journey of learning Lean Six Sigma, seeing how basic theories and analysis taught in my AP statistics class helped process improvement in a real business setting.
(Photo credit: Getty Images/Laurence Dutton)